September 15, 2023 — 6 min read
Improving Observability
Feature flags have become ubiquitous in the modern software development lifecycle for organizations across the world. Decoupling features from deployment, A/B testing, and gradual rollouts of features are a few of the benefits that come along with using feature flags.
Check out our usescases documentation for more information on how feature flags can be used in your organization.
Feature flags allow for safety and ease of mind when rolling out features, but what happens when this new functionality behind feature flags are ready to be deployed fully? What tools do you need in place to monitor for unexpected application behavior? How can the organization correlate flag changes with regressions, or erratic results in their application behavior?
These questions demonstrate how there is a need for tighter coupling of feature flags to obvservability tooling. As a feature flaging tool at our core, we believe that we can introduce functionality to make this easier on our users and integrators to achieve tighter correlation with what can be observed while running in production. This blog post will highlight some of the features we have recently implemented to streamline that correlation.
Webhooks
In the v1.21.0 release, Flipt introduced the Audit Sink functionality where users can configure events in Flipt to be sent to a sink for auditability.
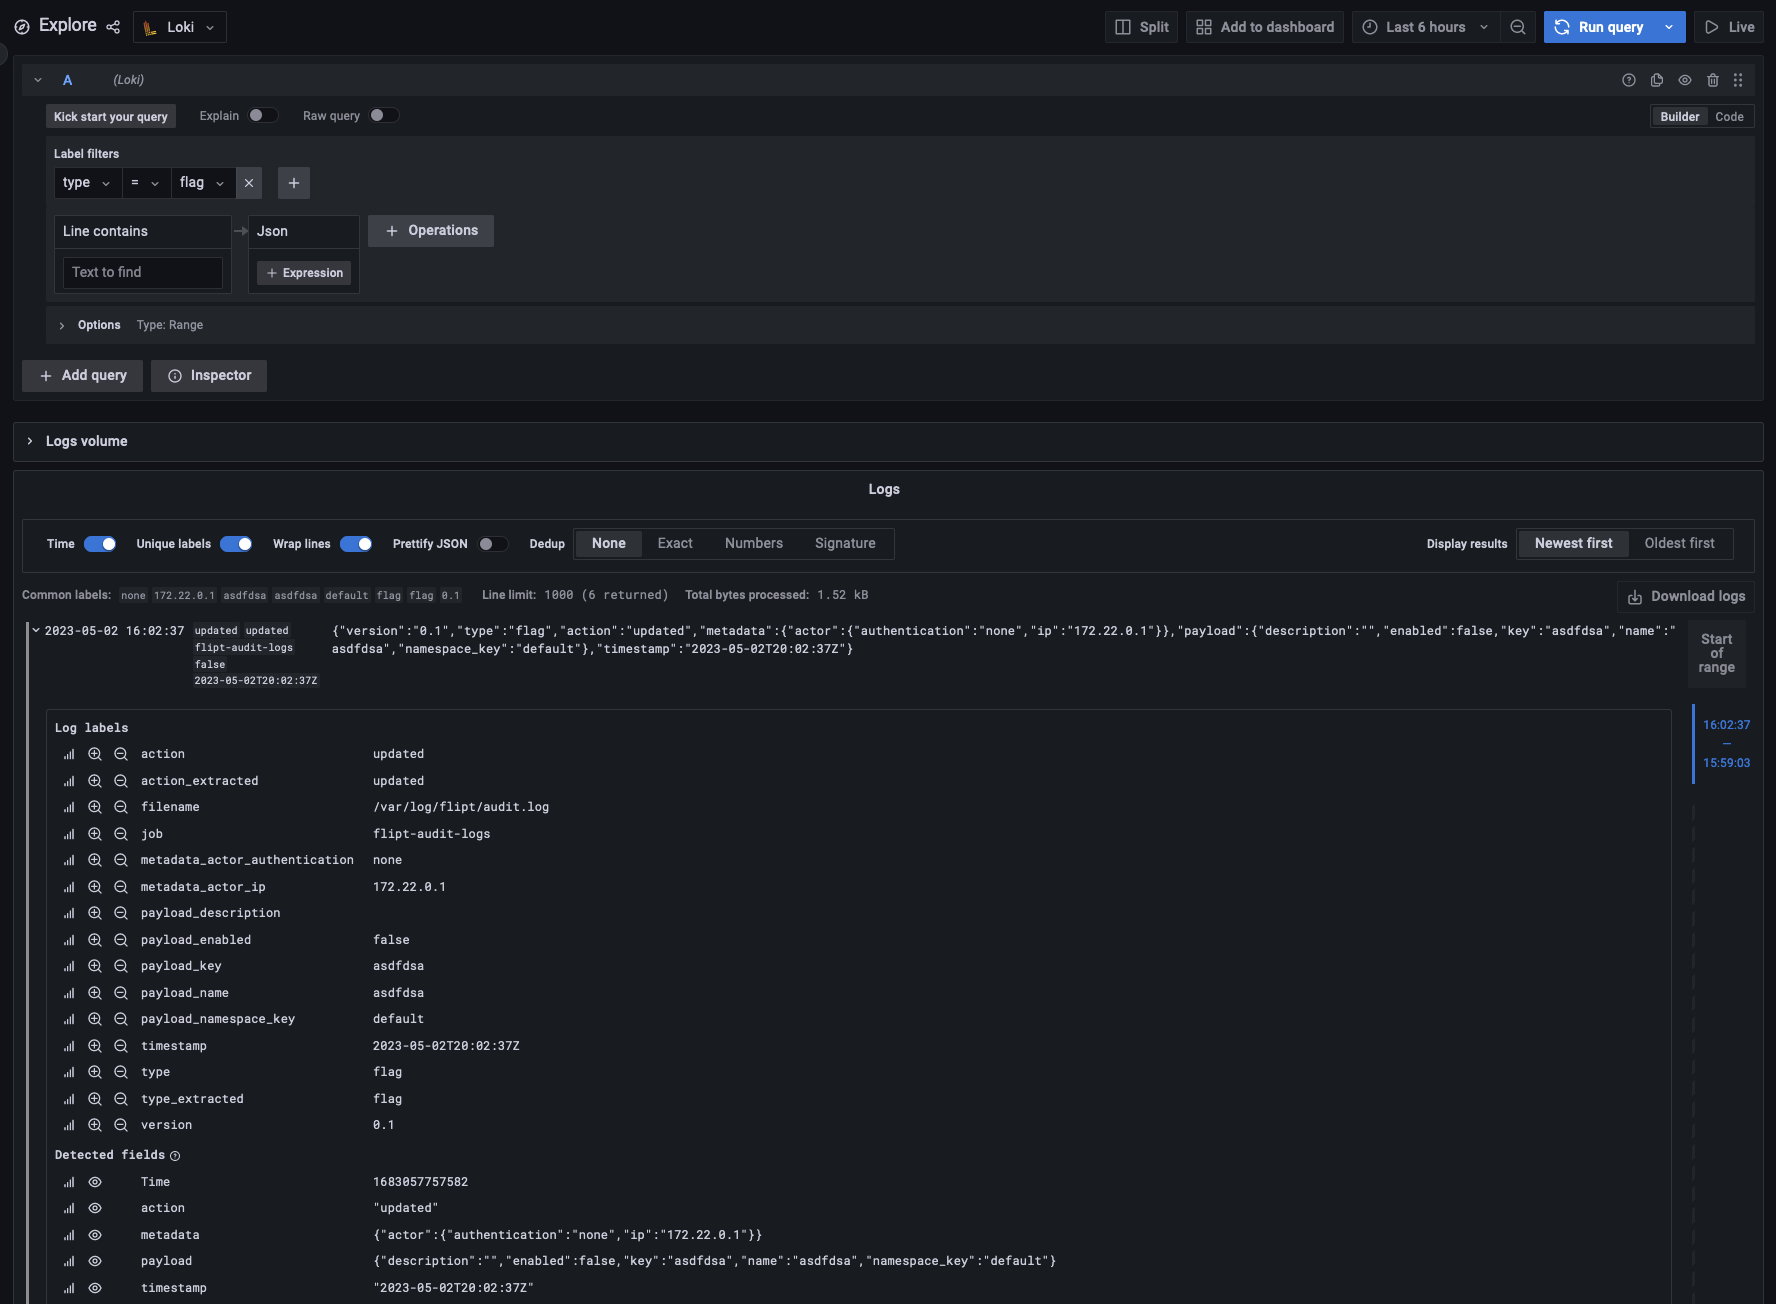
That release came with implementation for the inaugural sink which was a log file. These events are all CUD (create, update, delete) operations on Flipt entities (flags, variants, segments, constraints, rules, rollouts, distributions, tokens).
The log file was easy enough to get started, but hard to centralize that data to make any use out of it. The user would have to have additional tooling, such as Grafana Loki, to gather the logs in a centralized location since the logs can be distributed amongst many Flipt instances.
As of v1.27.0, we have released functionality for a sending audit event payloads to a webhook sink. 🎉
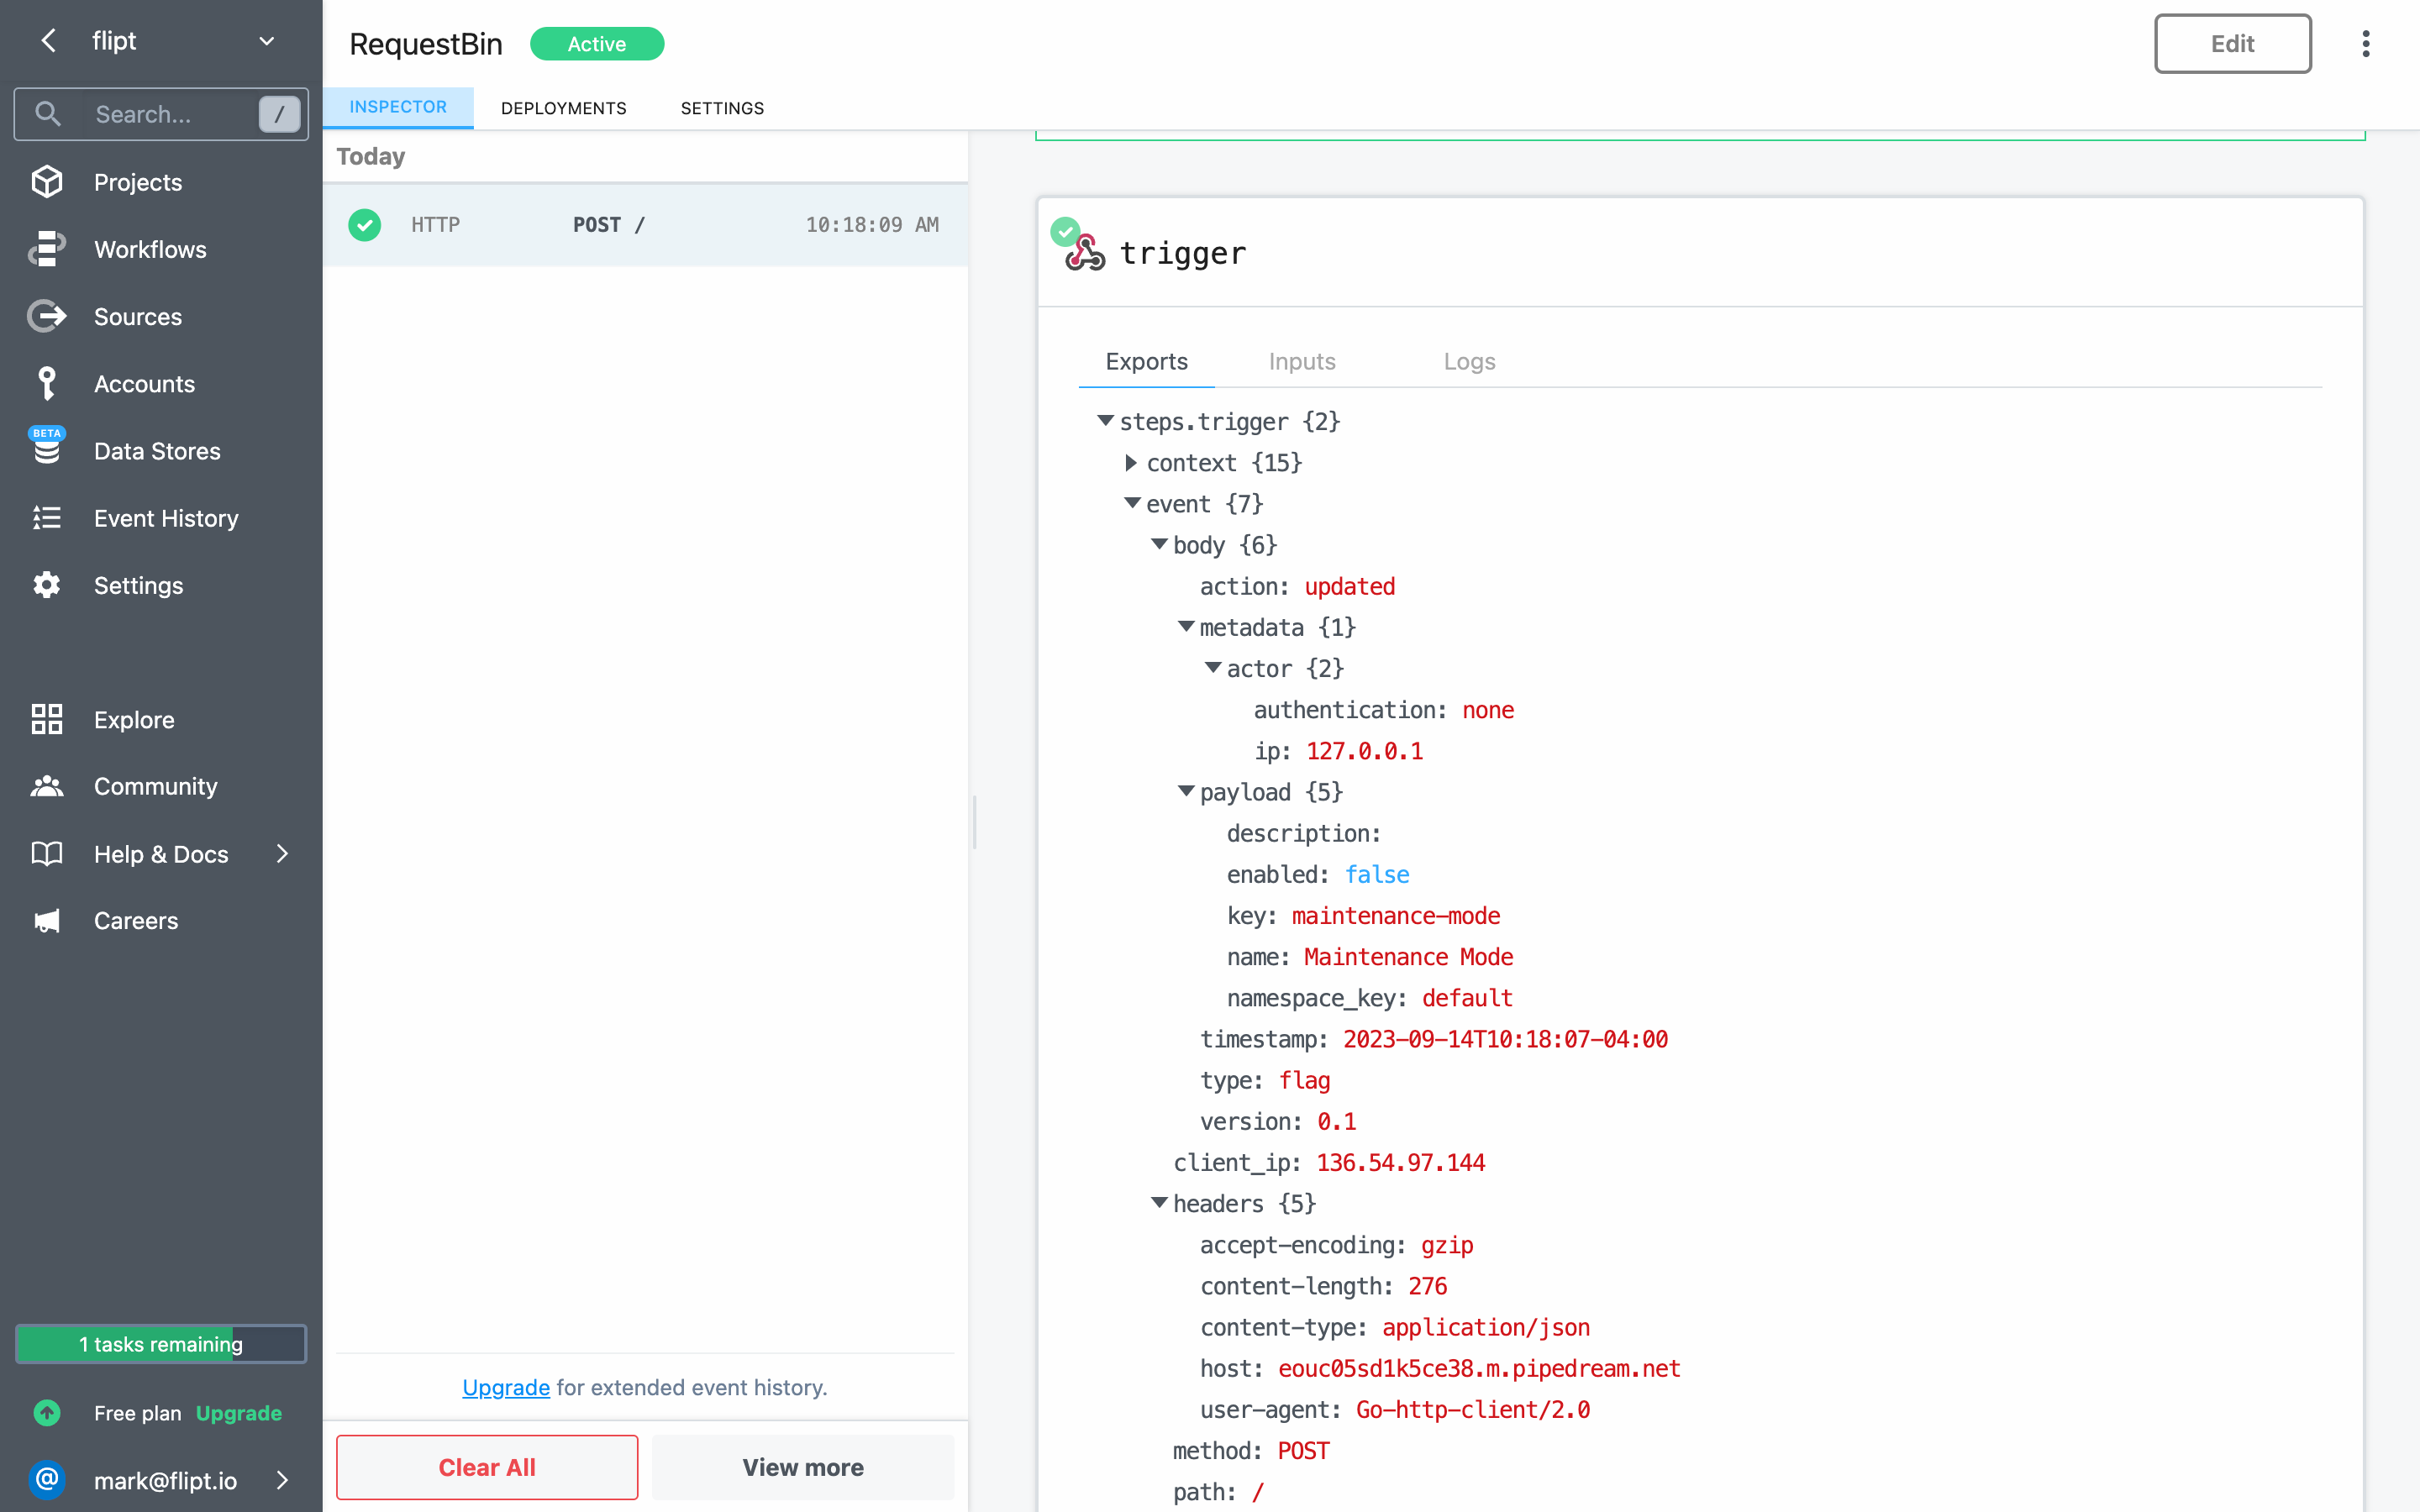
Webhooks are a common way for applications to send data to a URL when an event happens. If you are familiar with GitHub, you may have seen the webhooks functionality that allows you to configure a URL to send events to when certain actions happen on a repository. This is the same concept in Flipt.
You can configure a URL with the audit.sinks.webhook.url value and start receiving events as they happen to the web server that the URL is pointing to.
Use cases include: get notified in a Slack channel when a new flag is created, or transform and post that event to an Events API in your observability solution (ie: Datadog). The webhook sink also can be configured with a signing secret to allow users to validate the event originated from somewhere appropriate.
You can start using this functionality today! Check out the documentation for more information as well as an example in our main repository.
Datadog
Datadog has long established themselves as a giant in the observability SaaS space. Knowing this, we figured that our users would benefit from tighter integrations with Datadog. The following sections will highlight some of the features we have implemented to allow for an improved observability experience if using Flipt with Datadog.
Exporting OTLP Traces
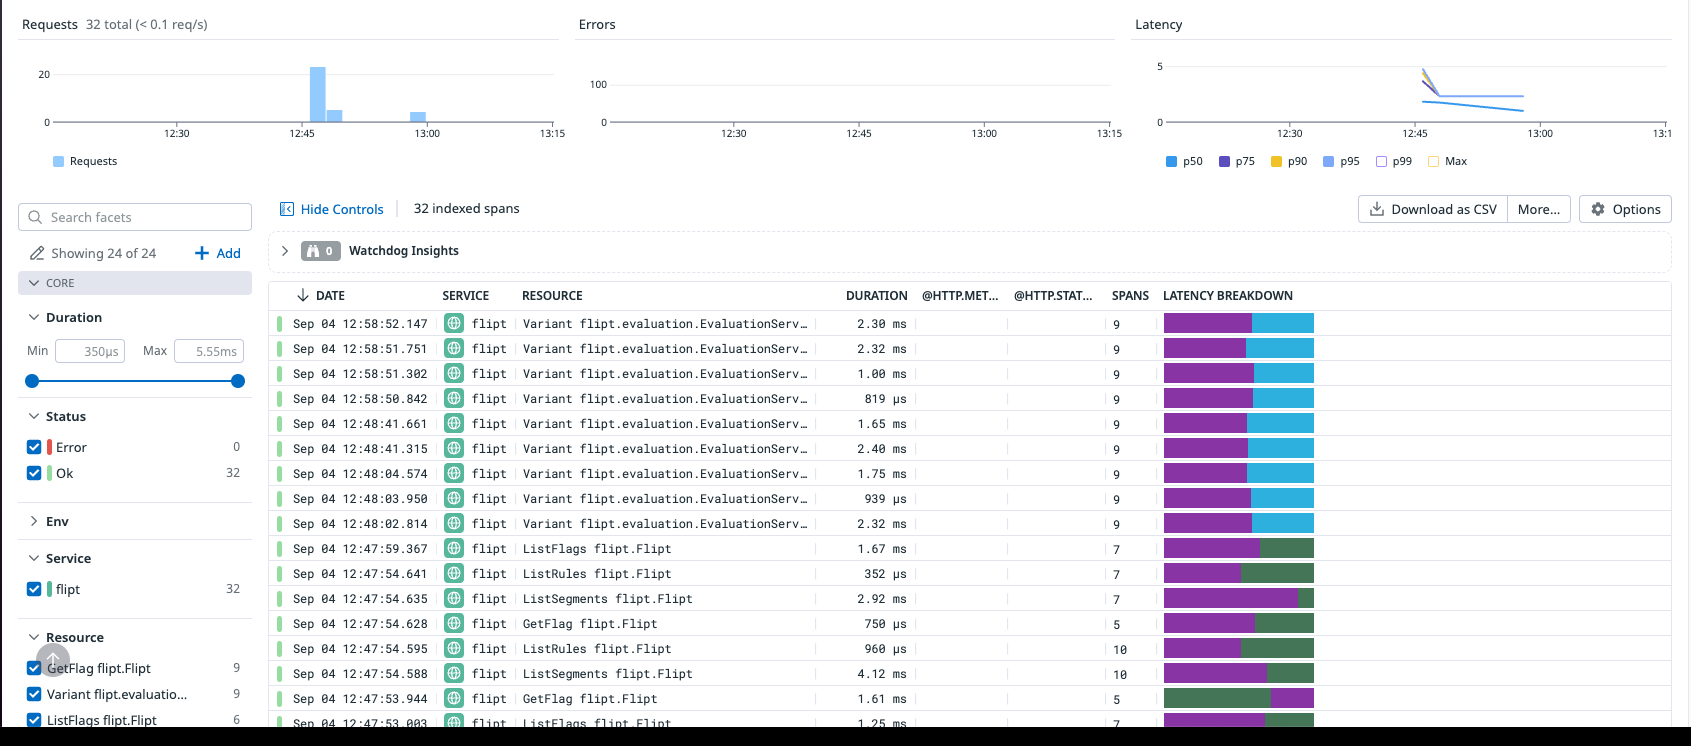
Flipt already has the ability to emit OTLP traces to a configured collector. This depends on you spinning up the OTLP collector in your stack, and using the URL for that collector as configuration for Flipt. Until now however, we havent done a great job documenting how you could send your OTLP traces to third party tool such as Datadog.
We have recently published an example on how to configure tracing with Datadog through the OTLP collector. Once the traces arrive in Datadog, you can leverage built-in features to correlate traces and logs, and logs with metrics, a nice two-way correlation. As things regress or errant things happen in your application, you can use these features to quickly track down a problem, and possibly correlate them to a switch in a feature flag.
RUM
Many times organizations want a better view of not only what occurs server-side in their applications, but also on the front-end. For example, you might want to see exactly what steps a user took during a session, where the user might have navigated away (bounced), and a variety of other metrics. Organizations can use feature flags to supplement this especially when they are rolling out new UI functionality to see how a subset of users might react without rolling it out completely to their entire userbase.
Datadog Real User Monitoring (RUM) is a drop in client that you can use within your front-end to capture the metrics that you care about during a user's session. The RUM client also has functionality for tracking the values of feature flags and correlating that with the metrics that the RUM client already keeps track of.
As of v0.2.11 of our Node/TypeScript client, we now have the ability to integrate with Datadog RUM natively.
Here's an example of how you can use the client to send evaluated values of feature flags to Datadog RUM:
const metricsClient = new FliptMetrics(
  new FliptApiClient({
    environment: "http://localhost:8080",
    auth: {
      credentials: {
        username: "YOUR_USERNAME",
        password: "YOUR_PASSWORD",
      },
    },
  }).evaluation,
  datadogRum
);

const response = await metricsClient.variant({
  namespaceKey: "default",
  flagKey: "hello-this",
  entityId: uuidv4(),
  context: {},
});
The README in the repository goes a bit more in depth of how you can enable that functionality.
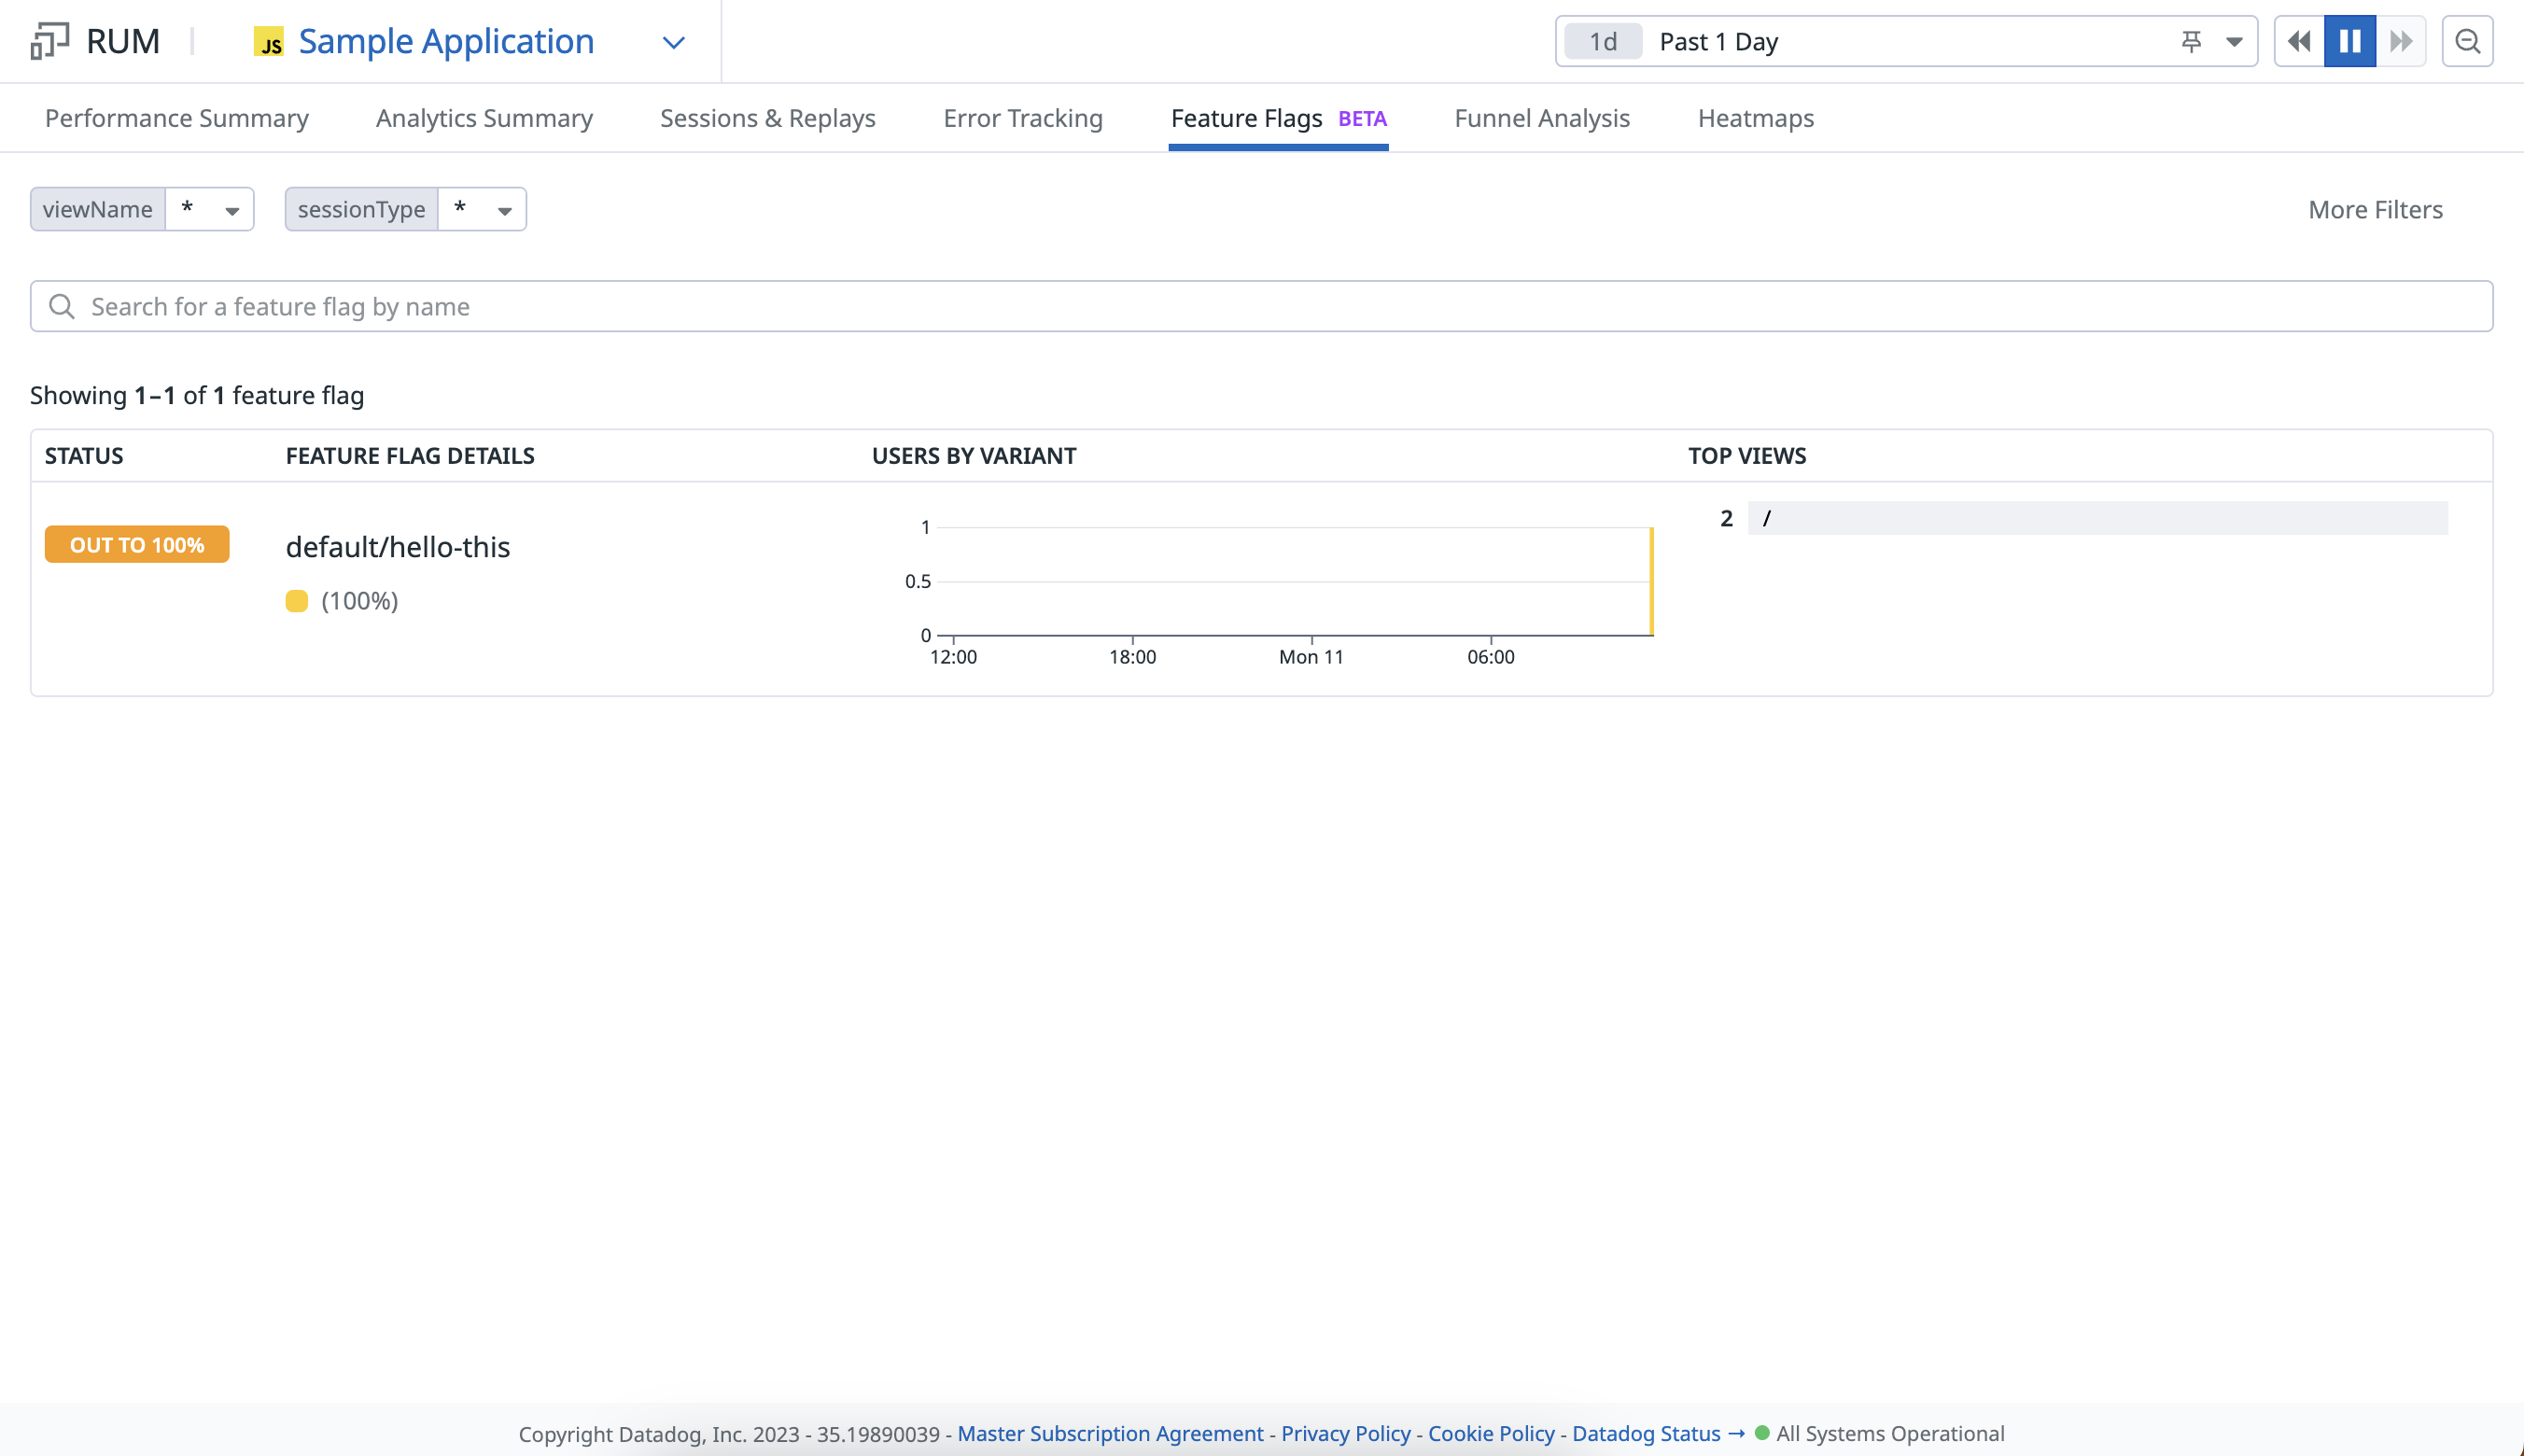
The above image shows an instance where the flag hello-this in the default namespace was enabled during the entirety of a user's session. On the same Datadog UI page, you can click on the Session & Replays tab to see how that new functionality behind the feature flag may have impacted the user session compared to users who the feature flag was off or evaluated false for.
Conclusion
With these new observability focused features, we hope to allow our users to gain more visibility into how feature flags are affecting their application/platform as a whole.
If you have any questions, other tools you'd like us to integrate with, or additional features you'd like to see added, please reach out to us on GitHub, X, or Discord.
We hope you enjoy these new features, and we look forward to hearing from you!
Related Posts

June 29, 2023
Announcing Flipt Labs
Today we’re announcing our open-source Flipt Labs project to show how to integrate real applications with Flipt

October 16, 2023
Flipt as a Sidecar
Demonstrating a way to run Flipt to achieve even faster evaluations
February 16, 2024
Elevating Feature Flag Analytics in Flipt
A deep dive into the latest release of Flipt, featuring first-class analytics for feature flag evaluations.